Regula Forensic Studio 5.8 Release Notes—November, 2026
All Devices
Added
Restoring image capture conditions
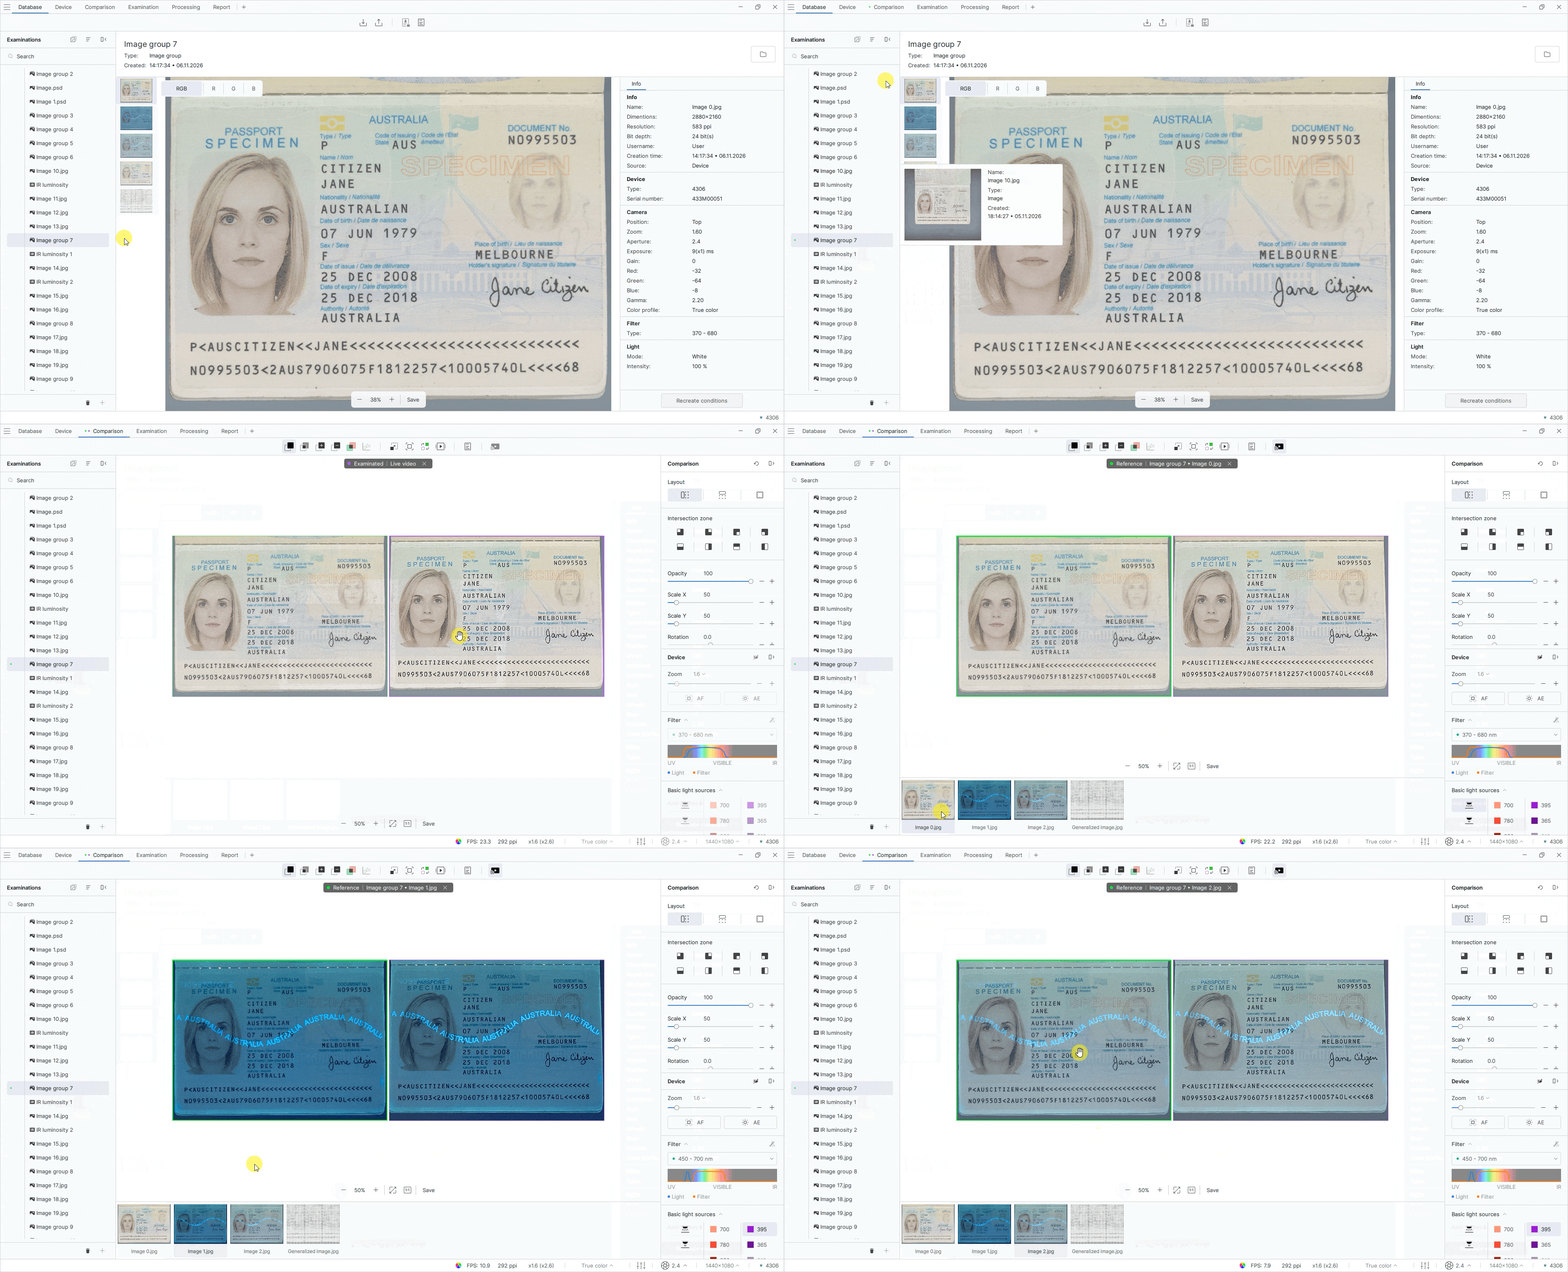
Automatic restoration of light source settings is now available when comparing images with live video. When you select an image in a comparison group, the software automatically applies the light source used to capture the selected image to the live video. If no light source information is available, automatic switching does not occur.
To restore image capture conditions, follow these steps:
- On the Database tab, in the Examinations panel, select the image group you created.
- Right-click the image group and add it to Comparison as either the reference or the examined item.
- Open the Comparison tab and select Live video for comparison. As you switch between images in the group, the light source settings used to capture each image are automatically restored for the live video.
Restoring capture conditions from the context menu
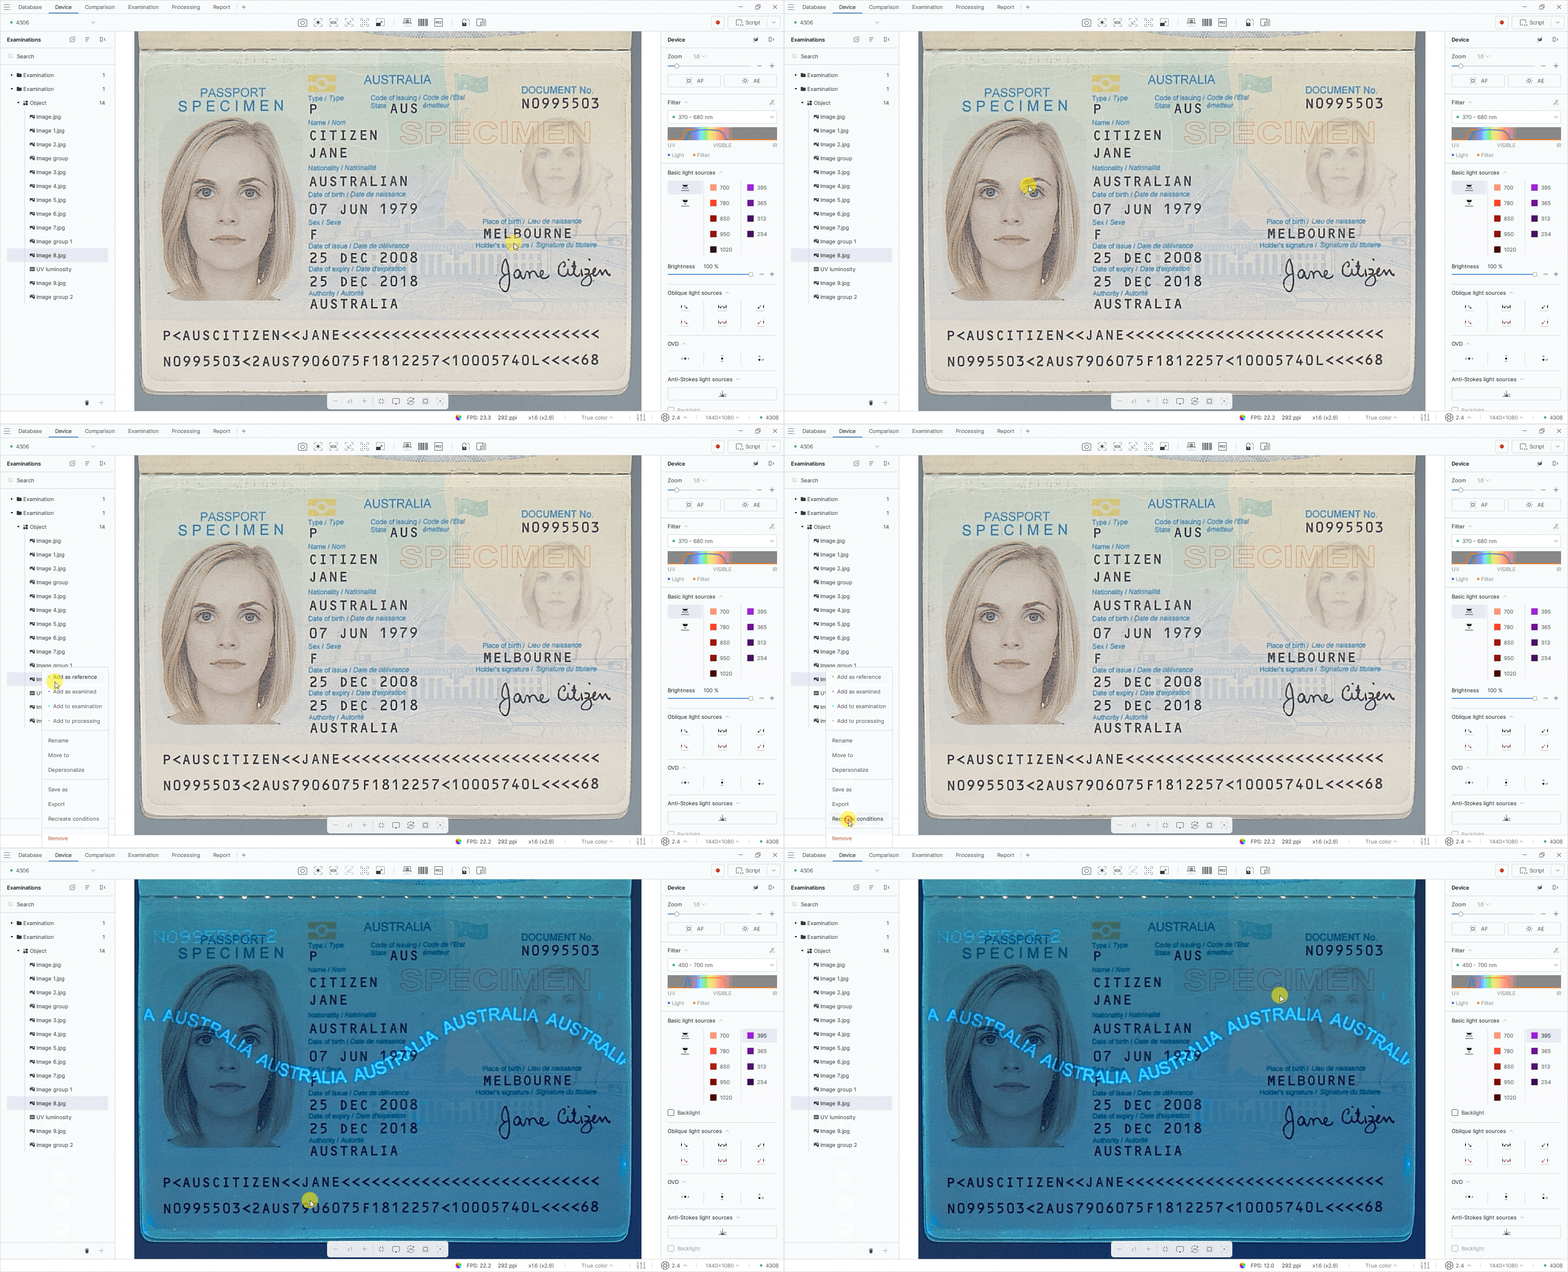
The Restore conditions command has been added to the image context menu. You can now restore image capture conditions directly from the file list by right-clicking an image and selecting the corresponding command. This feature is available only for supported images.
To restore image capture conditions, follow these steps:
- In the Examinations panel, select an image.
- Right-click the image.
- Select Restore conditions. The Device tab opens with the same light source settings that were used to capture the image.
Saving images in PSD format
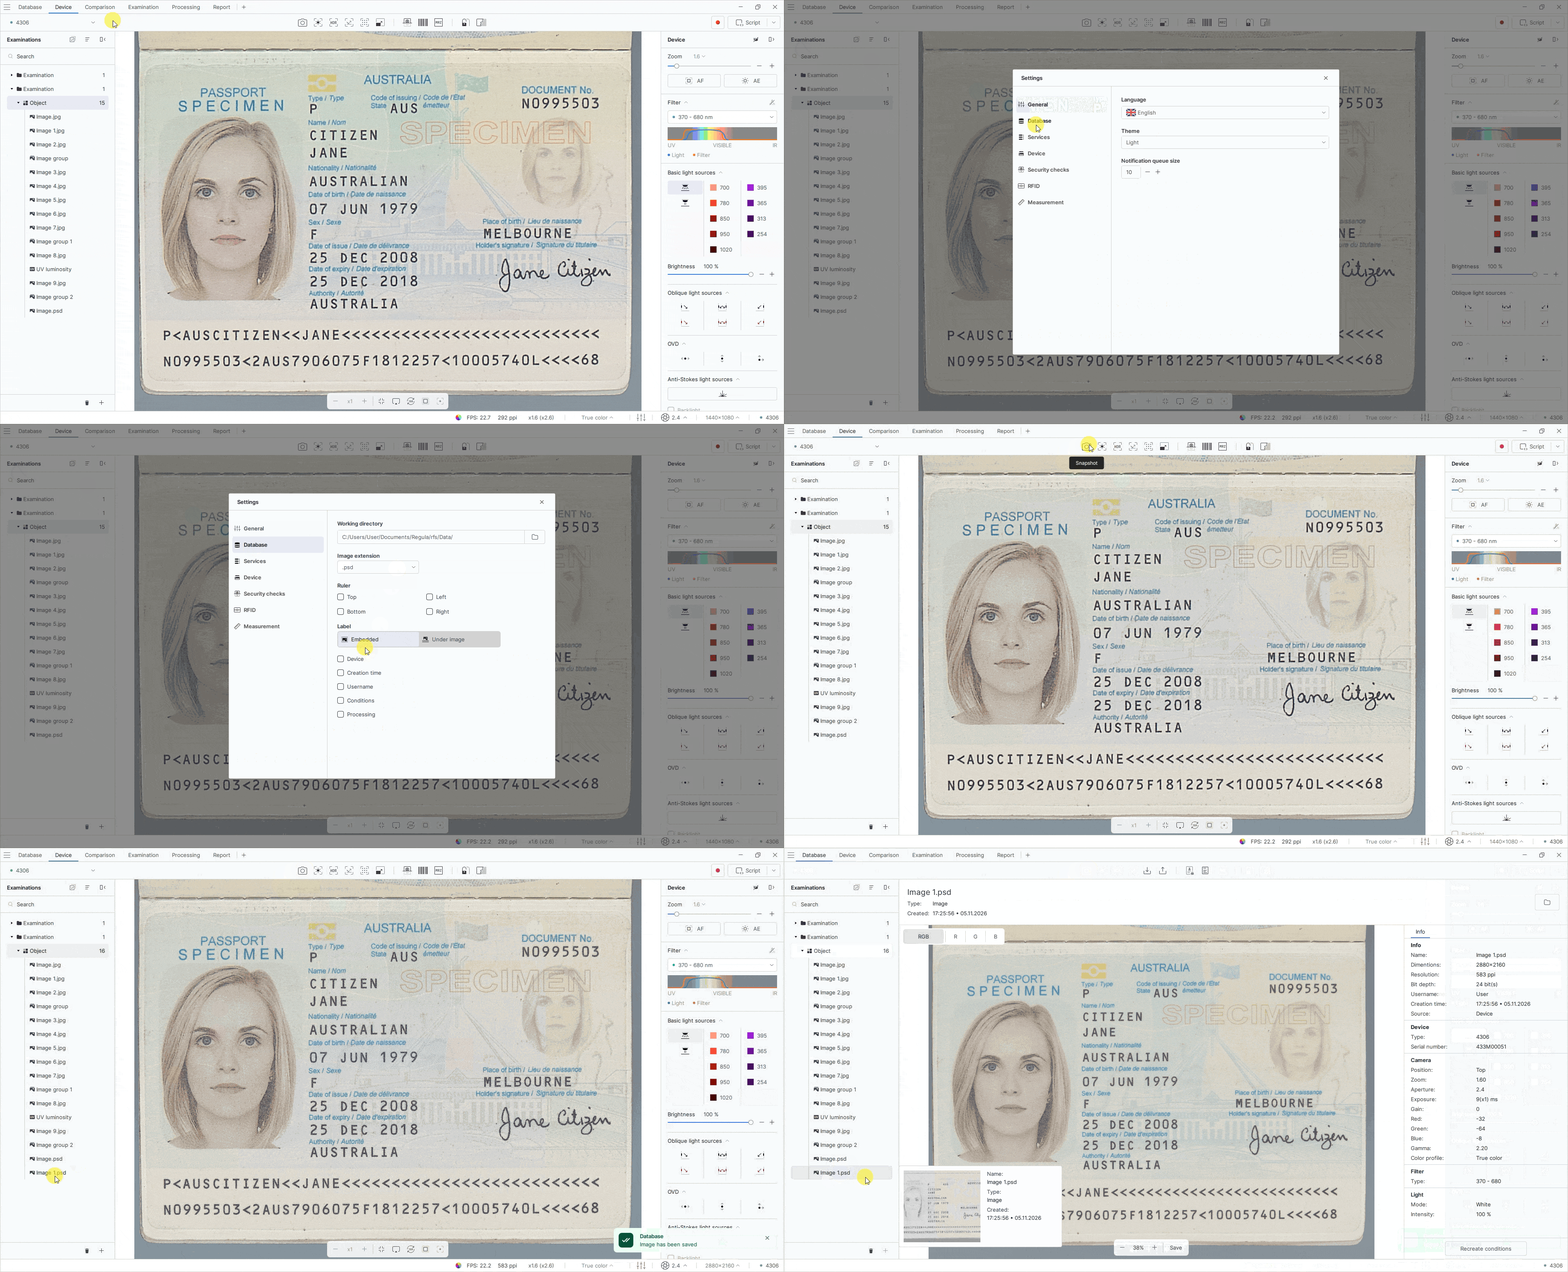
You can now save images in PSD (Adobe Photoshop Document) format for further editing in image editors.
To save images in PSD format, follow these steps:
- In the upper-right corner of the screen, open the menu and select Settings.
- On the Database tab, select the .psd from the Image extension drop-down list.
Using 5000 K white light with other light sources
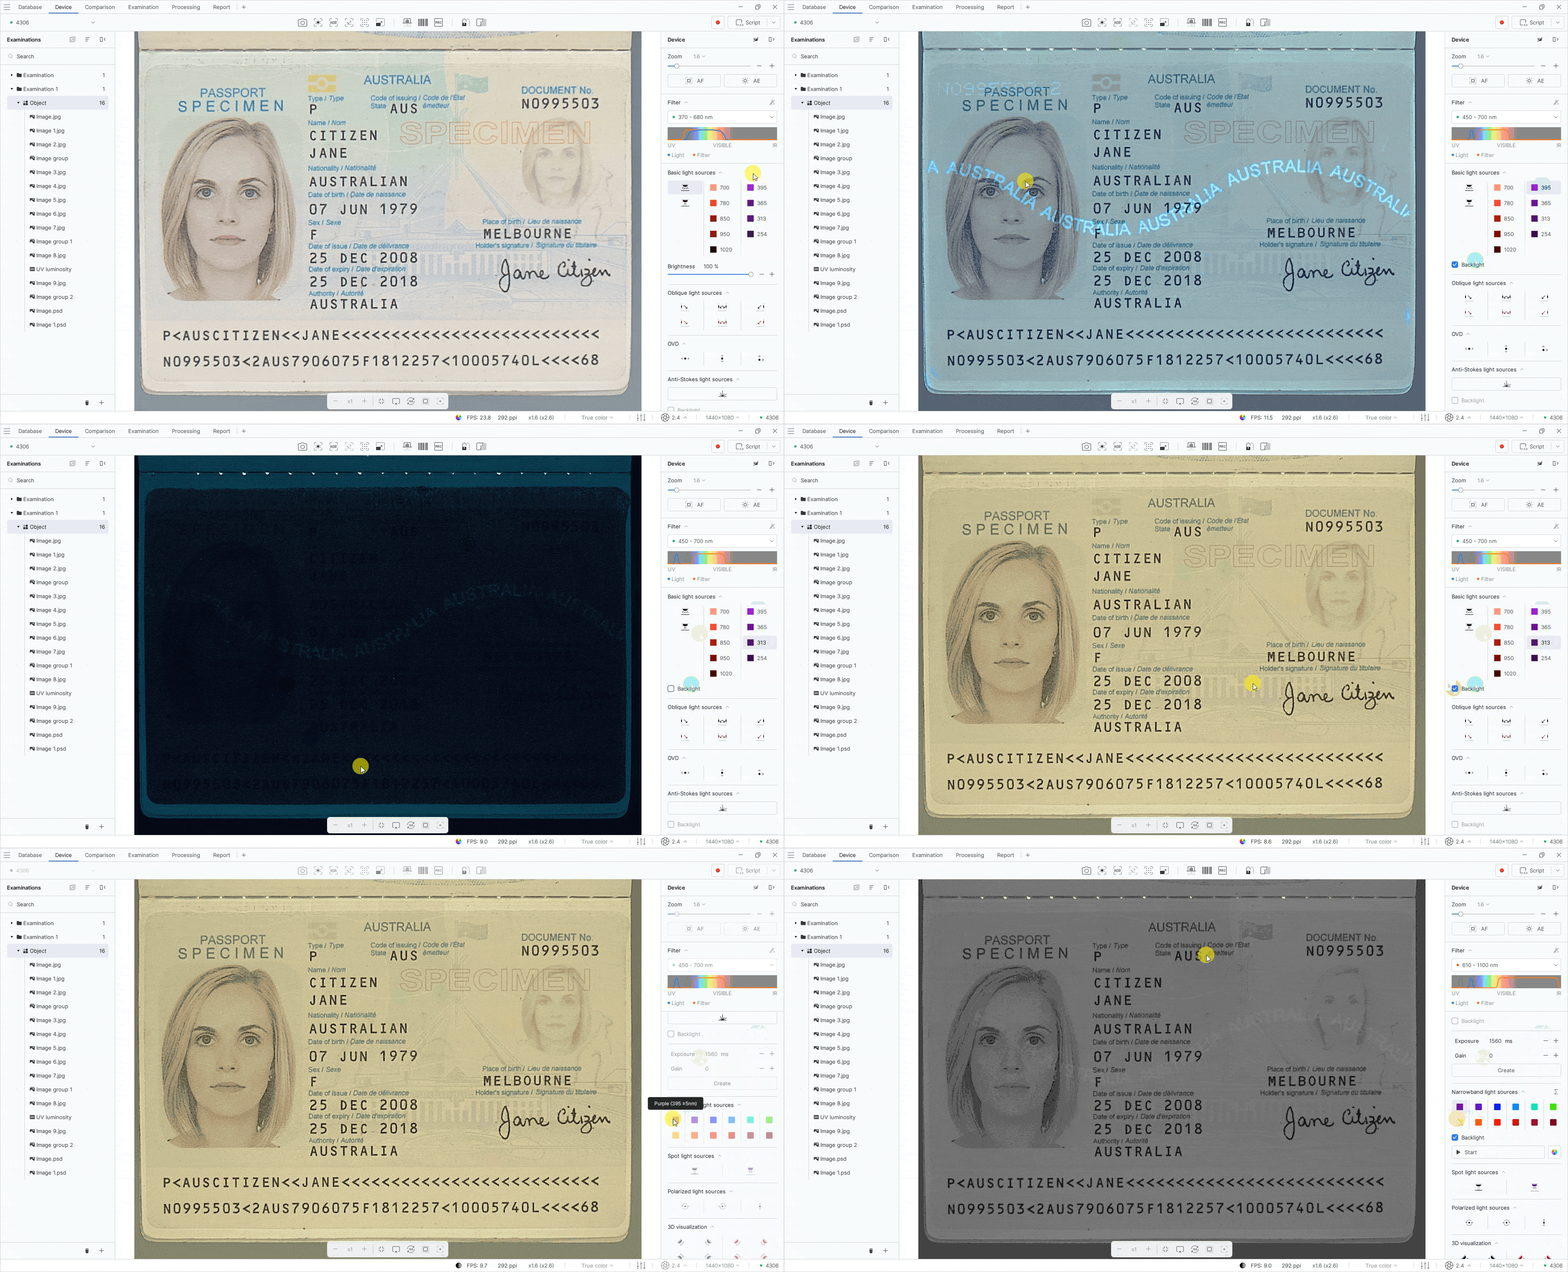
Added the ability to use 5000 K white light together with supported spectral light sources to improve the visibility of the examined object.
When a light source is selected, the Backlight checkbox appears, allowing users to additionally enable 5000 K white light without brightness adjustment. When enabled, the white light is activated directly on the device, allowing users to visually check the position of the document on the working surface.
Saving individual images captured in automatic IR luminescence mode
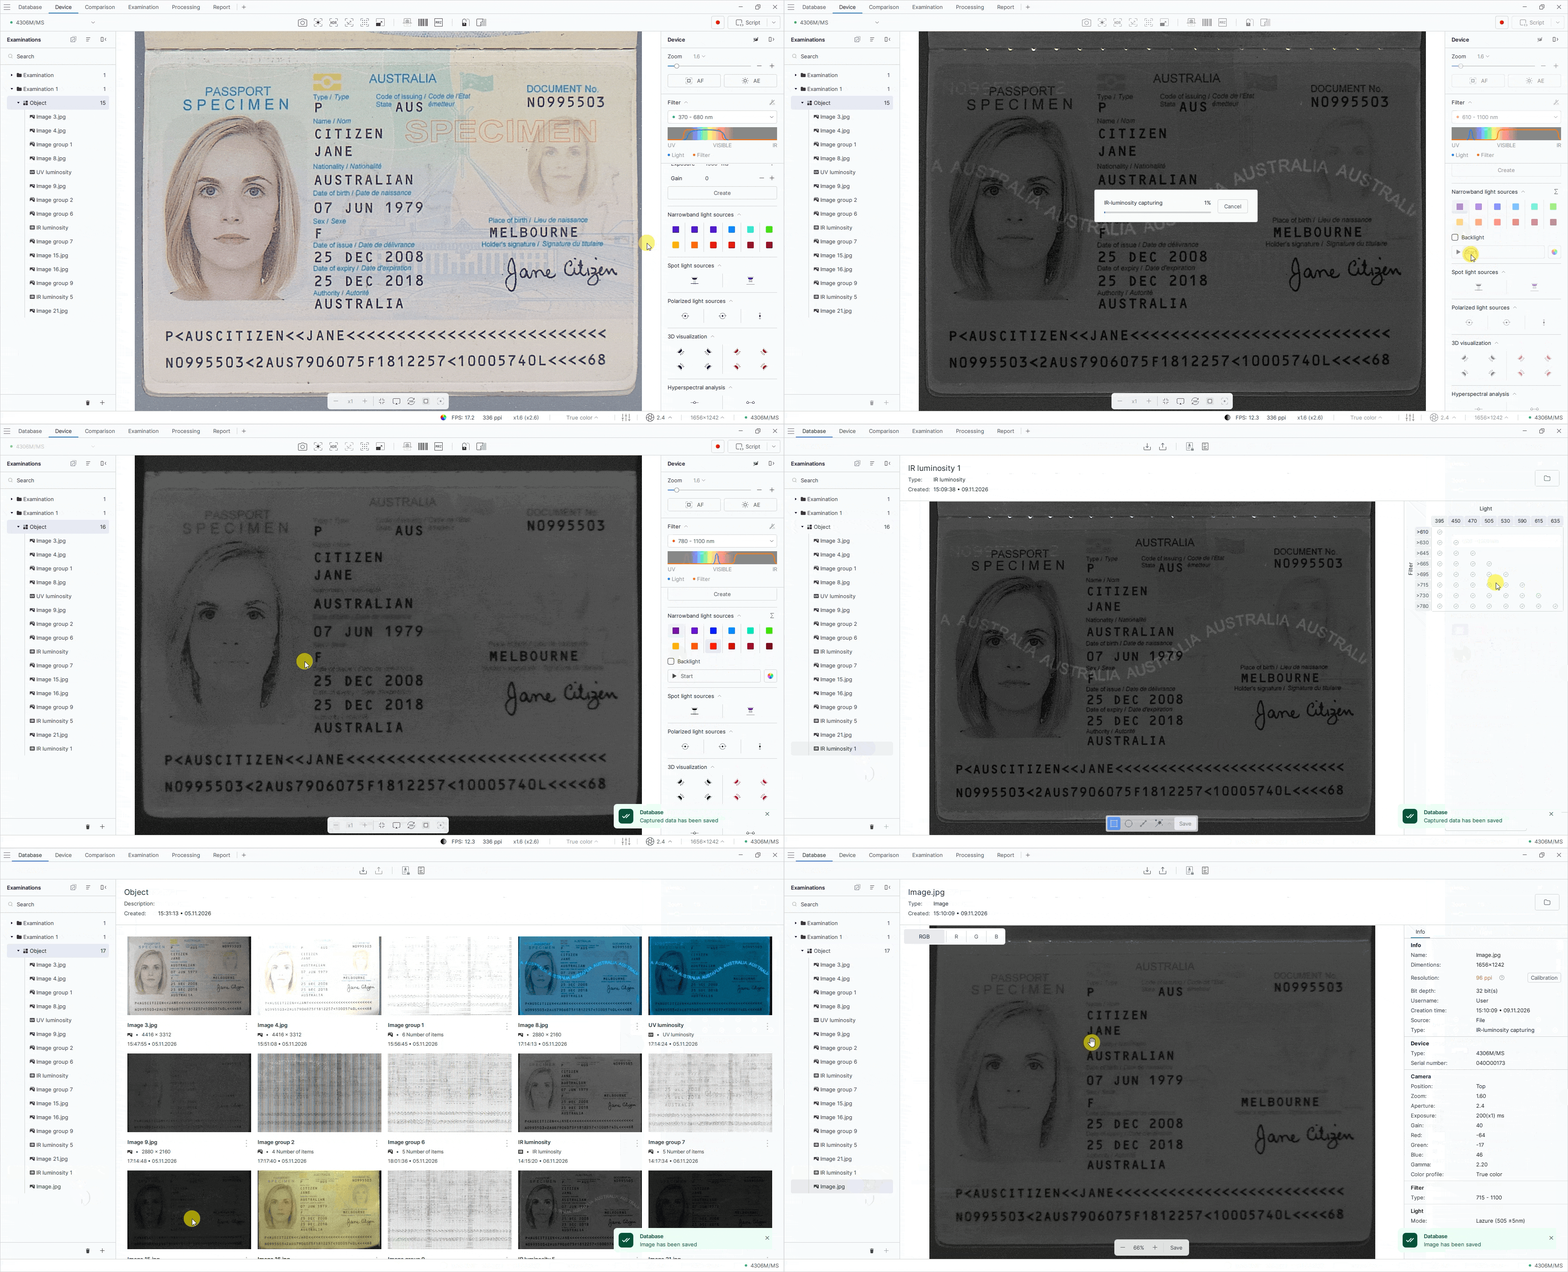
You can now extract a selected image from a group of automatic IR luminescence capture results without saving the entire group. Information about the light source and filter used is preserved in the extracted image’s metadata.
To extract a selected image from an automatic IR luminescence capture group without saving the entire group, follow these steps:
- On the Device tab, select the required IR light source in the Narrowband light sources group on the light source panel.
- Click Start.
- Open the resulting IR luminescence examination.
- In the Light/Filter table on the right panel, select the marker for the image you want to save.
- Click Save on the bottom toolbar. The image will be added to the database and will be available in the Examinations panel.
Displaying capture angles for OVD images
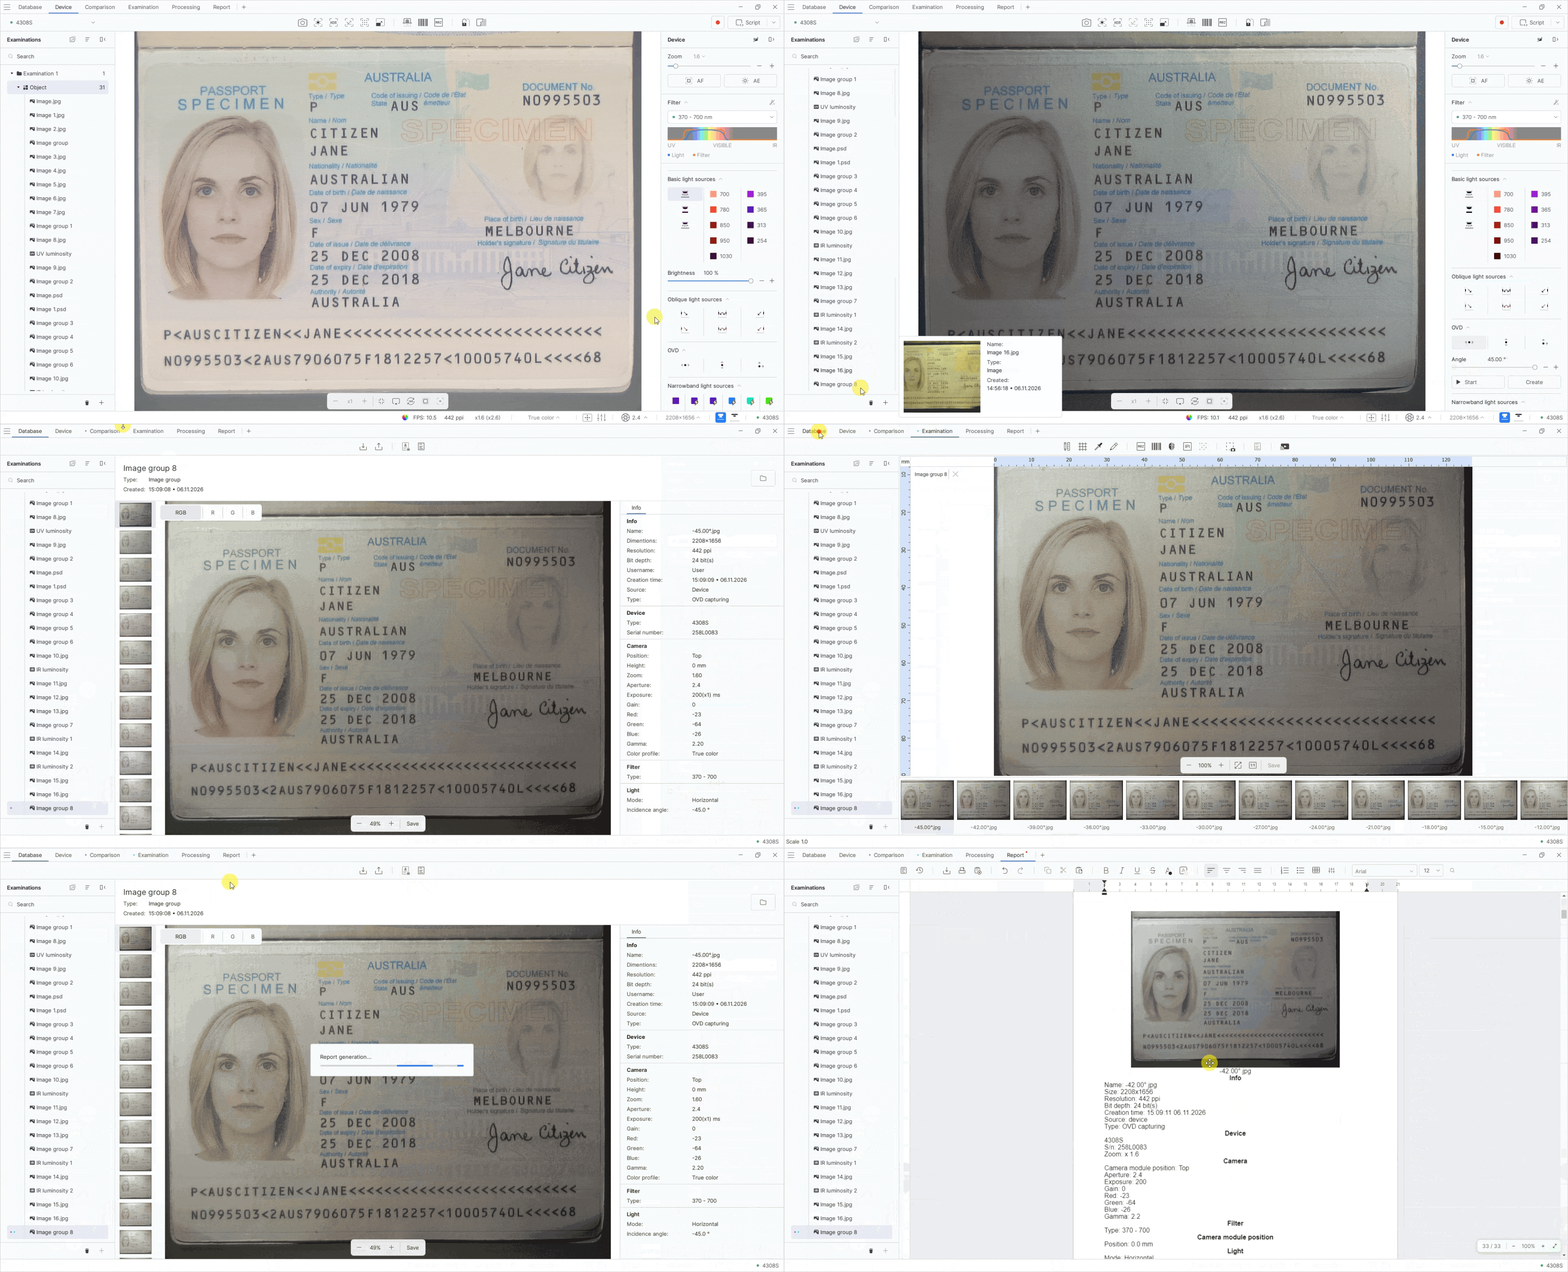
Capture angle values are now displayed in OVD image names on the Examination, Comparison, and Processing tabs, as well as in reports. Each image now includes the tilt angle of the light source used to capture it.
To display capture angles in OVD image names, follow these steps:
- On the Device tab, select the required light source in the OVD group on the light source panel.
- Click Start.
- Open the resulting image group.
- Right-click the image group and use the context menu to add it to Examination, Comparison, or Processing.
- To include the examination in a report, go to the Database tab and click Report.
Improved spectral graph markers
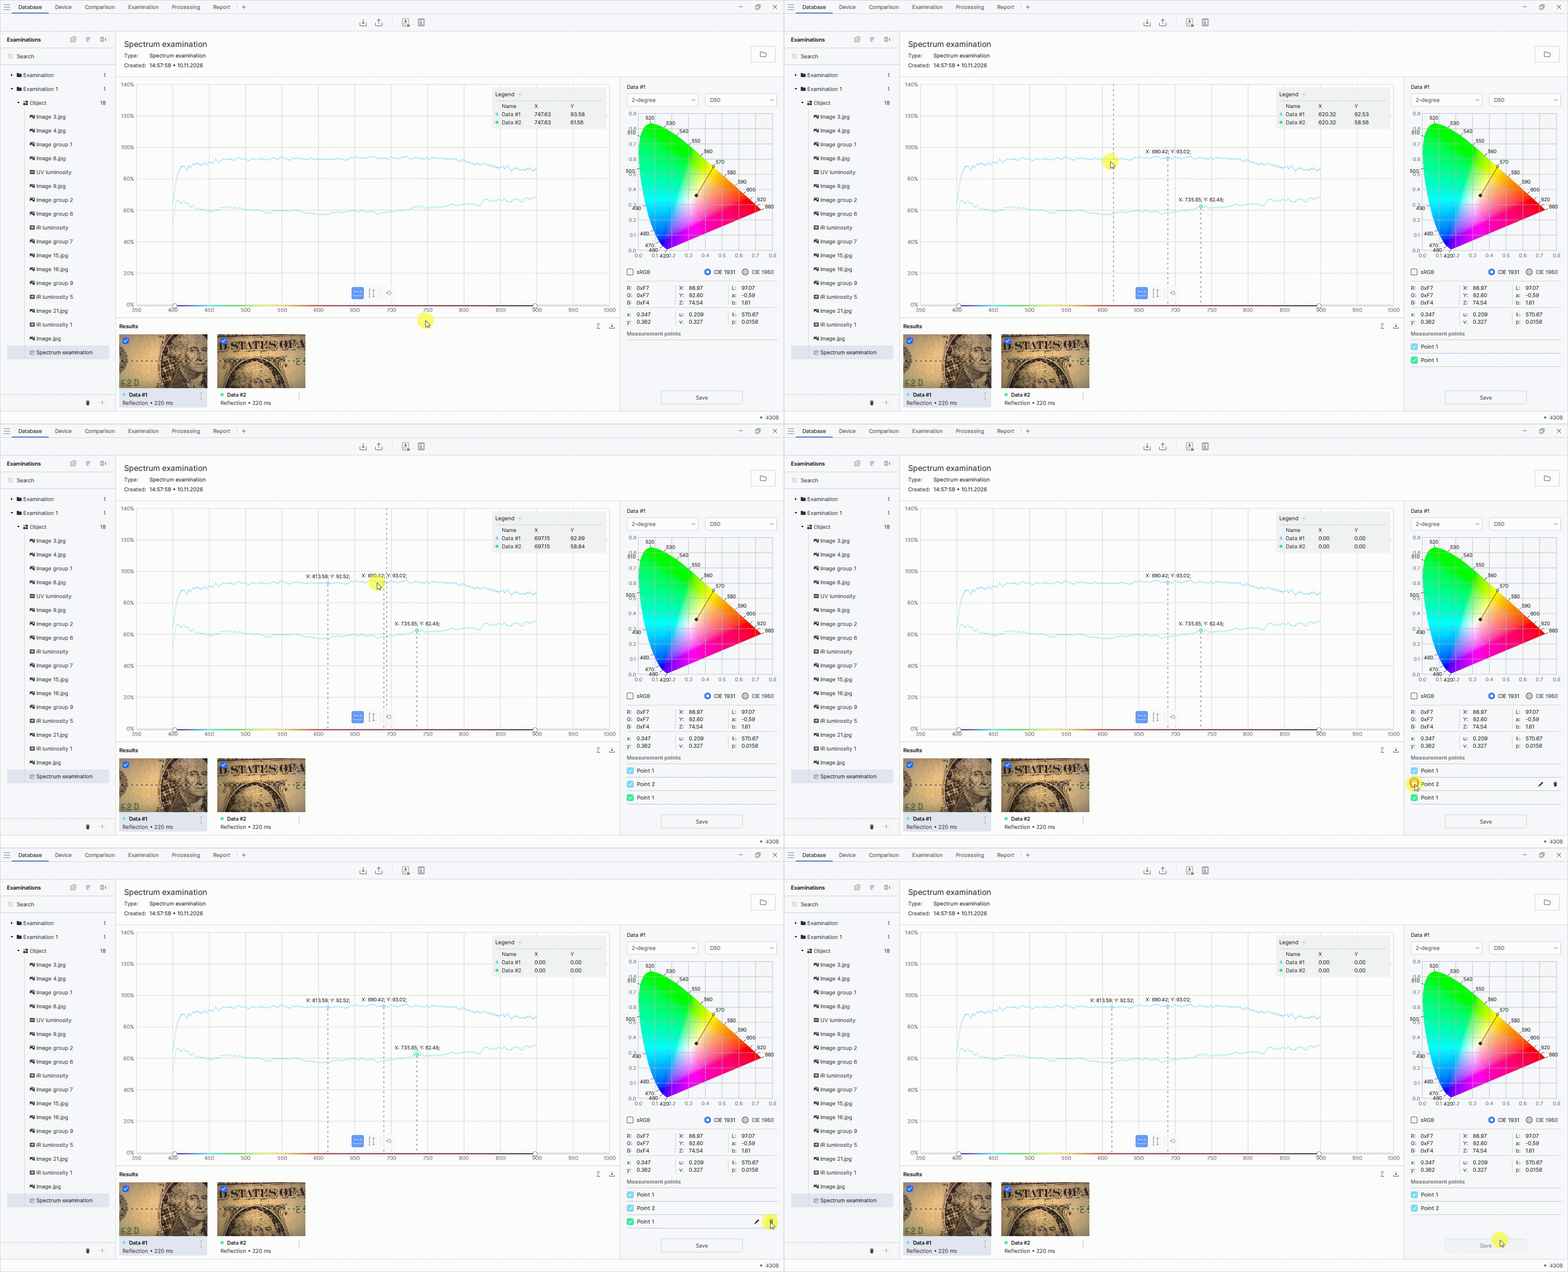
You can now mark characteristic points on spectra with vertical lines and display X-axis values directly on the graph. This makes it easier to compare spectra and identify their differences and similarities without opening a report.
To mark points on the spectral chart, follow these steps:
- On the Database tab, open a spectral examination.
- Click the desired point on the chart to display its X and Y coordinates.
Report structure changes
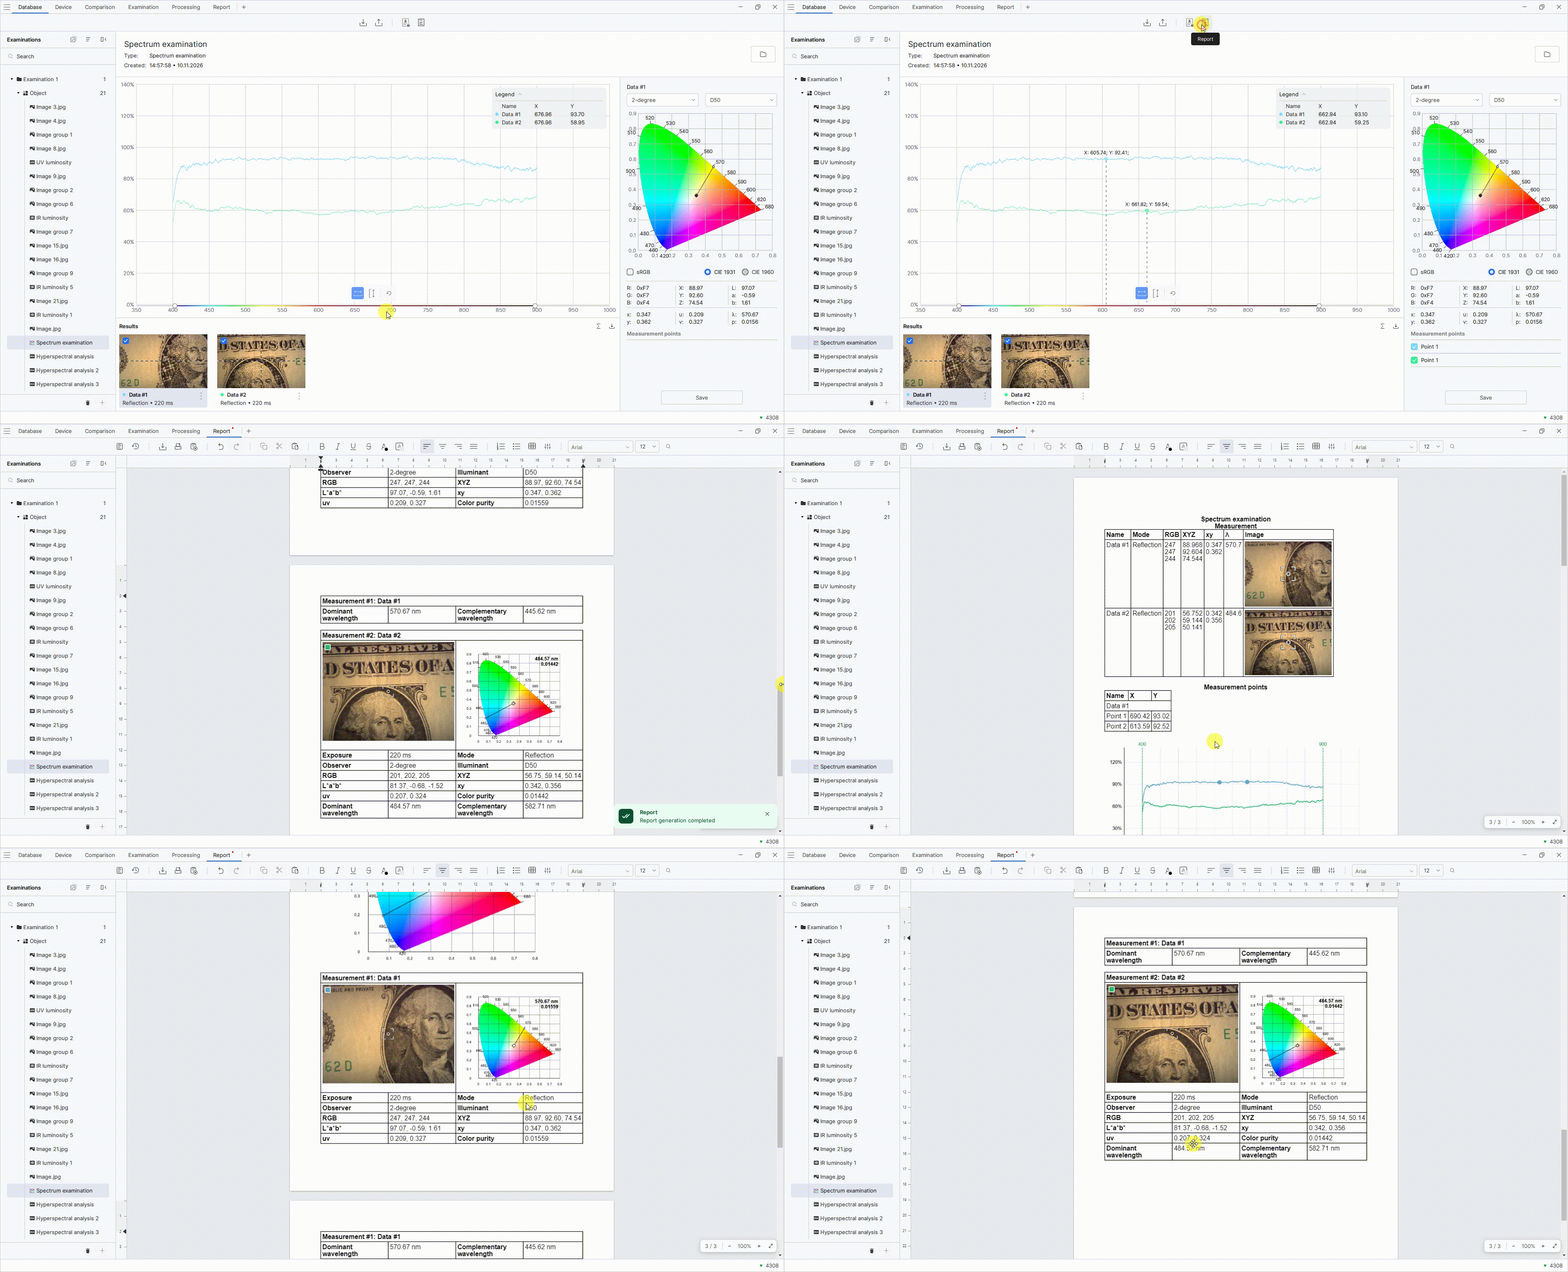
The report structure has been redesigned to improve the presentation of examination results, including spectral analysis.
To generate a spectral analysis report, follow these steps:
- On the Database tab, in the Examinations panel, open a spectral analysis examination.
- Mark the measurement points on the chart.
- At the top of the screen, click Report.
- Go to the Report tab. The generated report will contain a table of measurement results, a chart, a locus, and detailed information about the measurement points.
Adding HSA graphs to reports
HSA graph comparison results can now be included in reports. The report contains images, information, and measurement areas for each HSA result, as well as the selected wavelength and a combined comparison graph.
Comparing HSA graphs
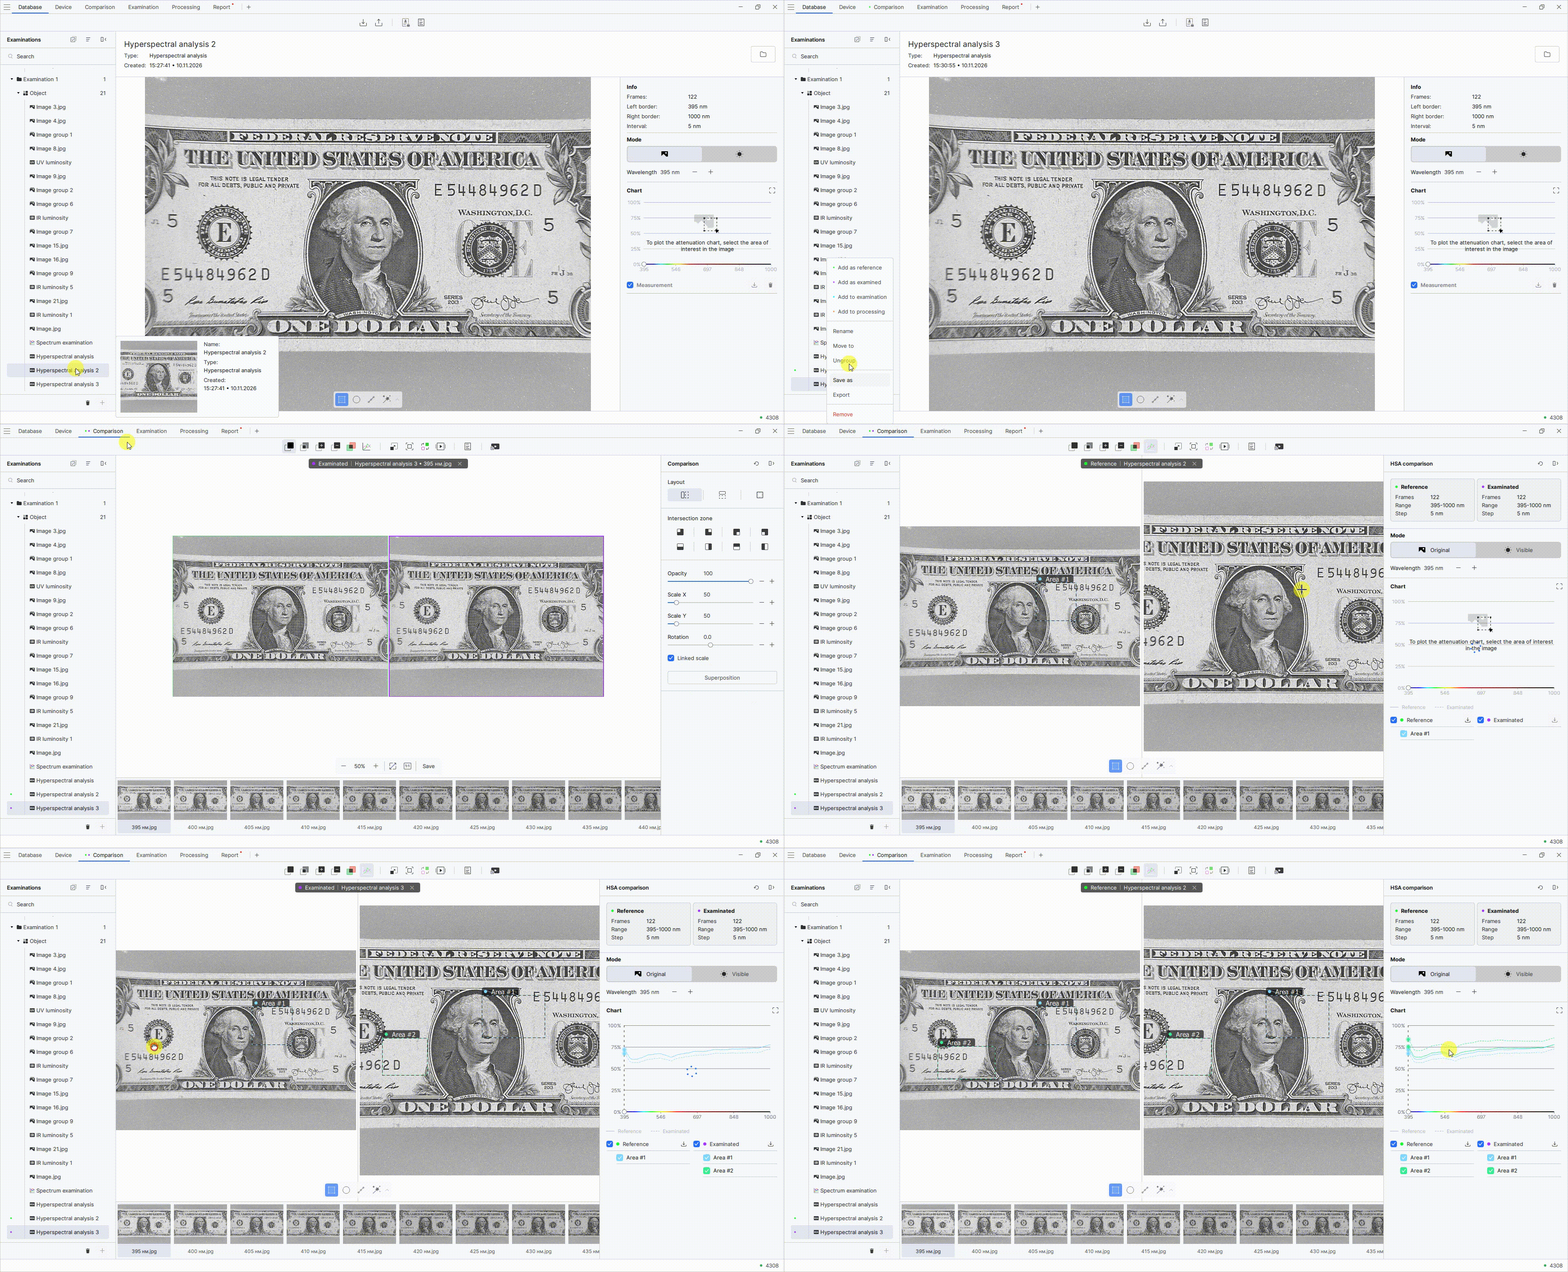
Added the ability to compare HSA charts to analyze the hyperspectral characteristics of objects whose images were captured under the same conditions.
To compare HSA charts, follow these steps:
- In the Examinations panel, select a saved hyperspectral analysis examination. Right-click and select Add as reference from the context menu.
- In the Examinations panel, select another hyperspectral analysis examination for comparison and click Add as examined from the context menu.
- Go to the Comparison tab.
- On the top toolbar, select Chart comparison.
- Select the areas to compare on the Reference and Examined images. The HSA comparison chart will appear on the right.
Improved measurement ruler display
The horizontal and vertical measurement rulers have been improved. Units are now shown at the rulers’ intersection and in a tooltip when you hover over them. The scale display has also been adjusted for consistent scaling.
Configuring the maximum notification queue size
You can now set the maximum number of messages in the notification queue. The Notification queue size setting is available under Settings on the General tab.
Adding a device inventory number and username
A new field has been added to Settings on the Device tab:
- Device inventory number—allows you to enter a device inventory number of up to 30 alphanumeric characters. The device inventory number is displayed in the Info section.
A new option has been added to Settings on the Database tab:
- Username—displays the current Windows username on the image. This option is disabled by default.
The current Windows username is also automatically saved in the image metadata.
Canceling the OVD process
You can now cancel an OVD process while it is running. When you click Cancel, the process stops, the captured data is deleted, and the software returns to a state where you can restart the process or continue working.
Fixed
- Fixed an issue where the 180° image rotation was reset after MRZ recognition. The selected image orientation is now preserved after processing.
- Fixed incorrect zoom switching in HSA LSC when selecting magnifications above 2.0×. The actual magnification now matches the selected value.
- Fixed the display of slider thumbs. Slider thumbs are no longer clipped when moved to the far-left position.
- Fixed image generation in Long Exposure mode. Images are now generated correctly using the selected exposure time from 1 to 200 seconds.
- Fixed data display on the Report tab when opened in a separate window. The information is now preserved and displayed correctly.
- Fixed the recording of Wide Coaxial and Multi Coaxial light sources in scripts. Recorded steps now match the selected light sources.
- Fixed HSA graph generation on the built-in computer of the Regula 4308 device. Brightness dips and missing sections of the graph have been eliminated.
Improved
Grouping and ungrouping images
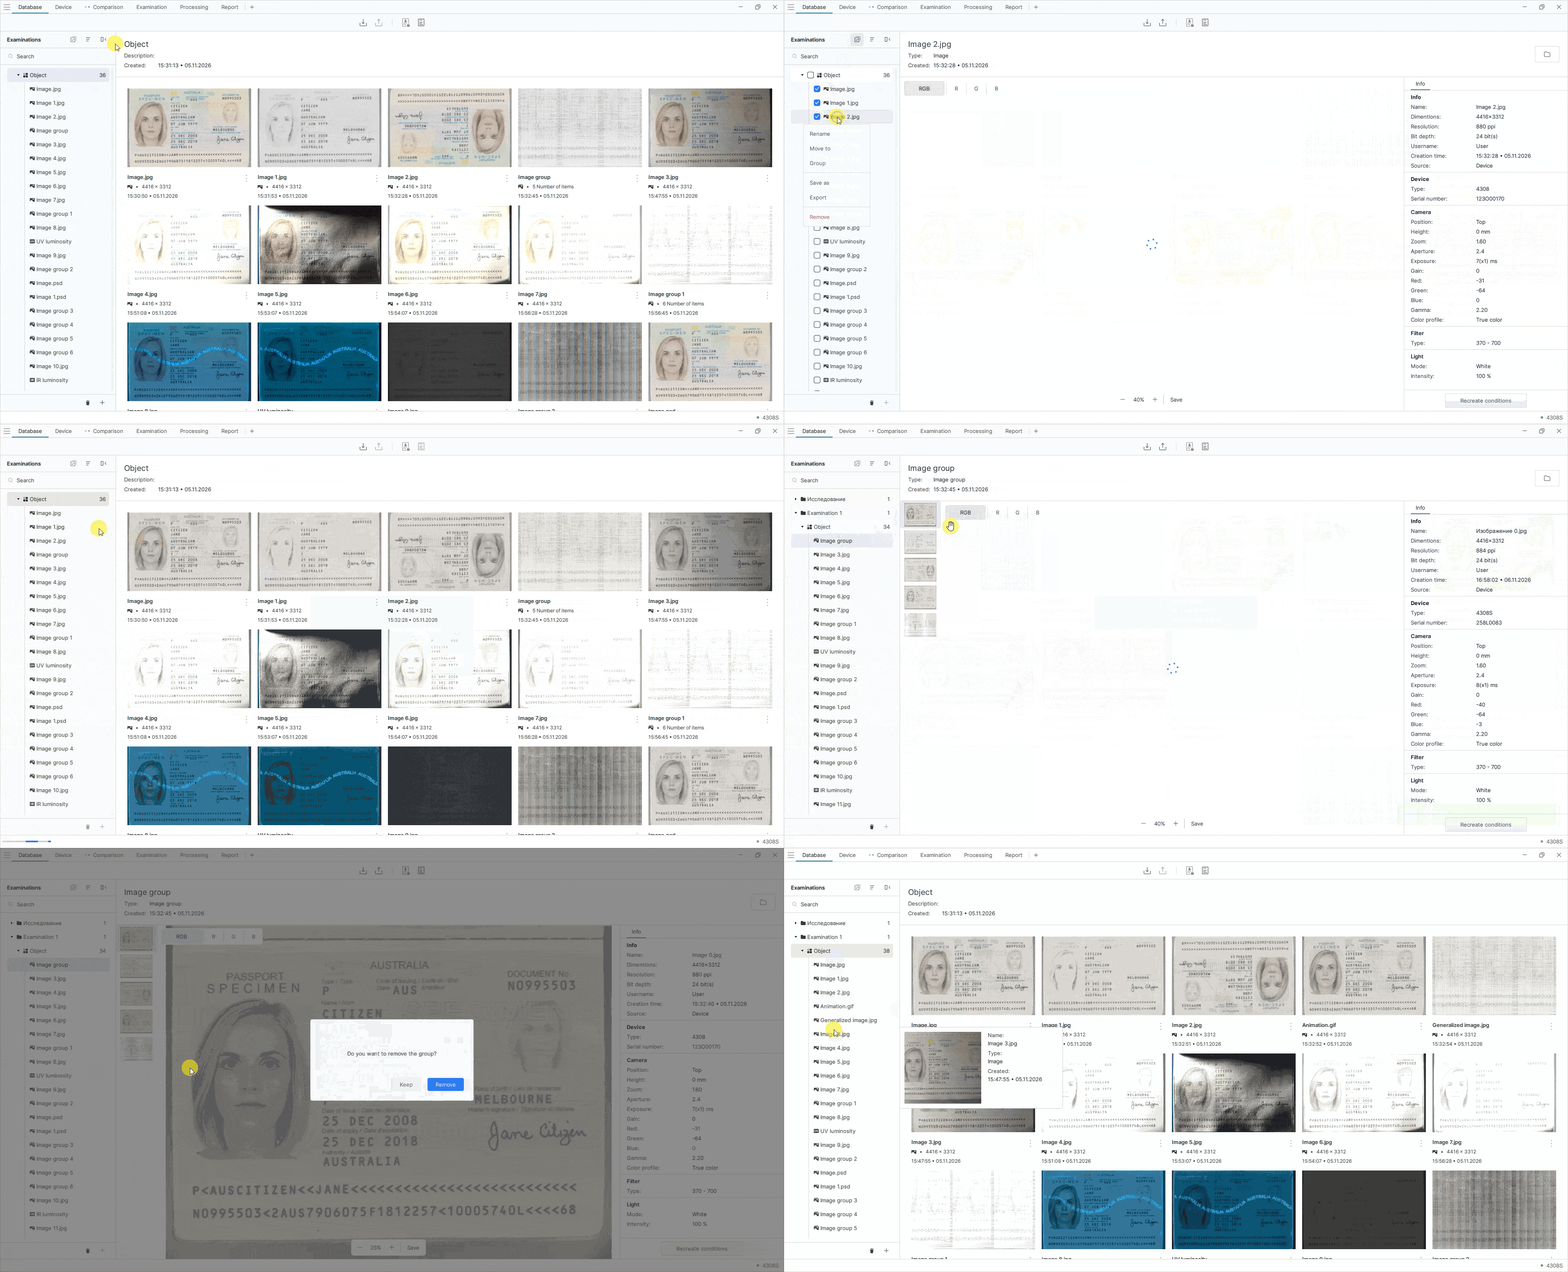
Image grouping and ungrouping have been improved. When grouping images, you can now keep or delete the original files; when ungrouping, you can keep or delete the original group.
To group images, follow these steps:
- On the top toolbar of the Examinations panel, click the button for working with multiple files.
- Select the images you want to group.
- Right-click and select Group from the context menu.
-
In the dialog box, choose what to do with the original images:
- Keep—keep the original images in the database.
- Delete—delete the original images from the database.
To ungroup images, follow these steps:
- On the Examinations panel, select an image group.
- Right-click and select Ungroup from the context menu.
-
In the dialog box, choose what to do with the group:
- Keep—keep the group after ungrouping the images.
- Delete—delete the group after ungrouping the images.
Optimizing autofocus and autoexposure
The behavior of autofocus and autoexposure during processes has been updated. Autofocus and autoexposure no longer start automatically after each process step.
Updating the image rotation function
On the Device tab, the icon and name of the Horizontal mirror function have been changed to Rotate 180°.
Restricting capture modes when the spectrometer is active
When the spectrometer is active, only Snapshot mode is available. The additional Long Exposure, HDR, SR, and Multifocus capture modes are disabled.
Optimizing light source brightness recording in scripts
The way light source brightness is recorded in scripts has changed. When you move the brightness slider, only the final value is added to the script, without intermediate steps.
Improved normalization when processing live video
The Correction tool on the Processing tab has been improved for live video. When normalization is applied again, the result no longer depends on the previously set Alpha-trimmed leveling parameter.
Changes to the IR texture function
The availability of the IR texture function in relief visualization modes has been clarified. The IR texture checkbox is now displayed only in Texture mode and disappears when switching to Surface mode.
Changed
Changing RFID reading behavior after barcode scanning
The automatic RFID chip reading logic after barcode scanning has been changed. RFID reading now starts only if the barcode scanning results contain an MRZ.
4306
Added
Light source check tool
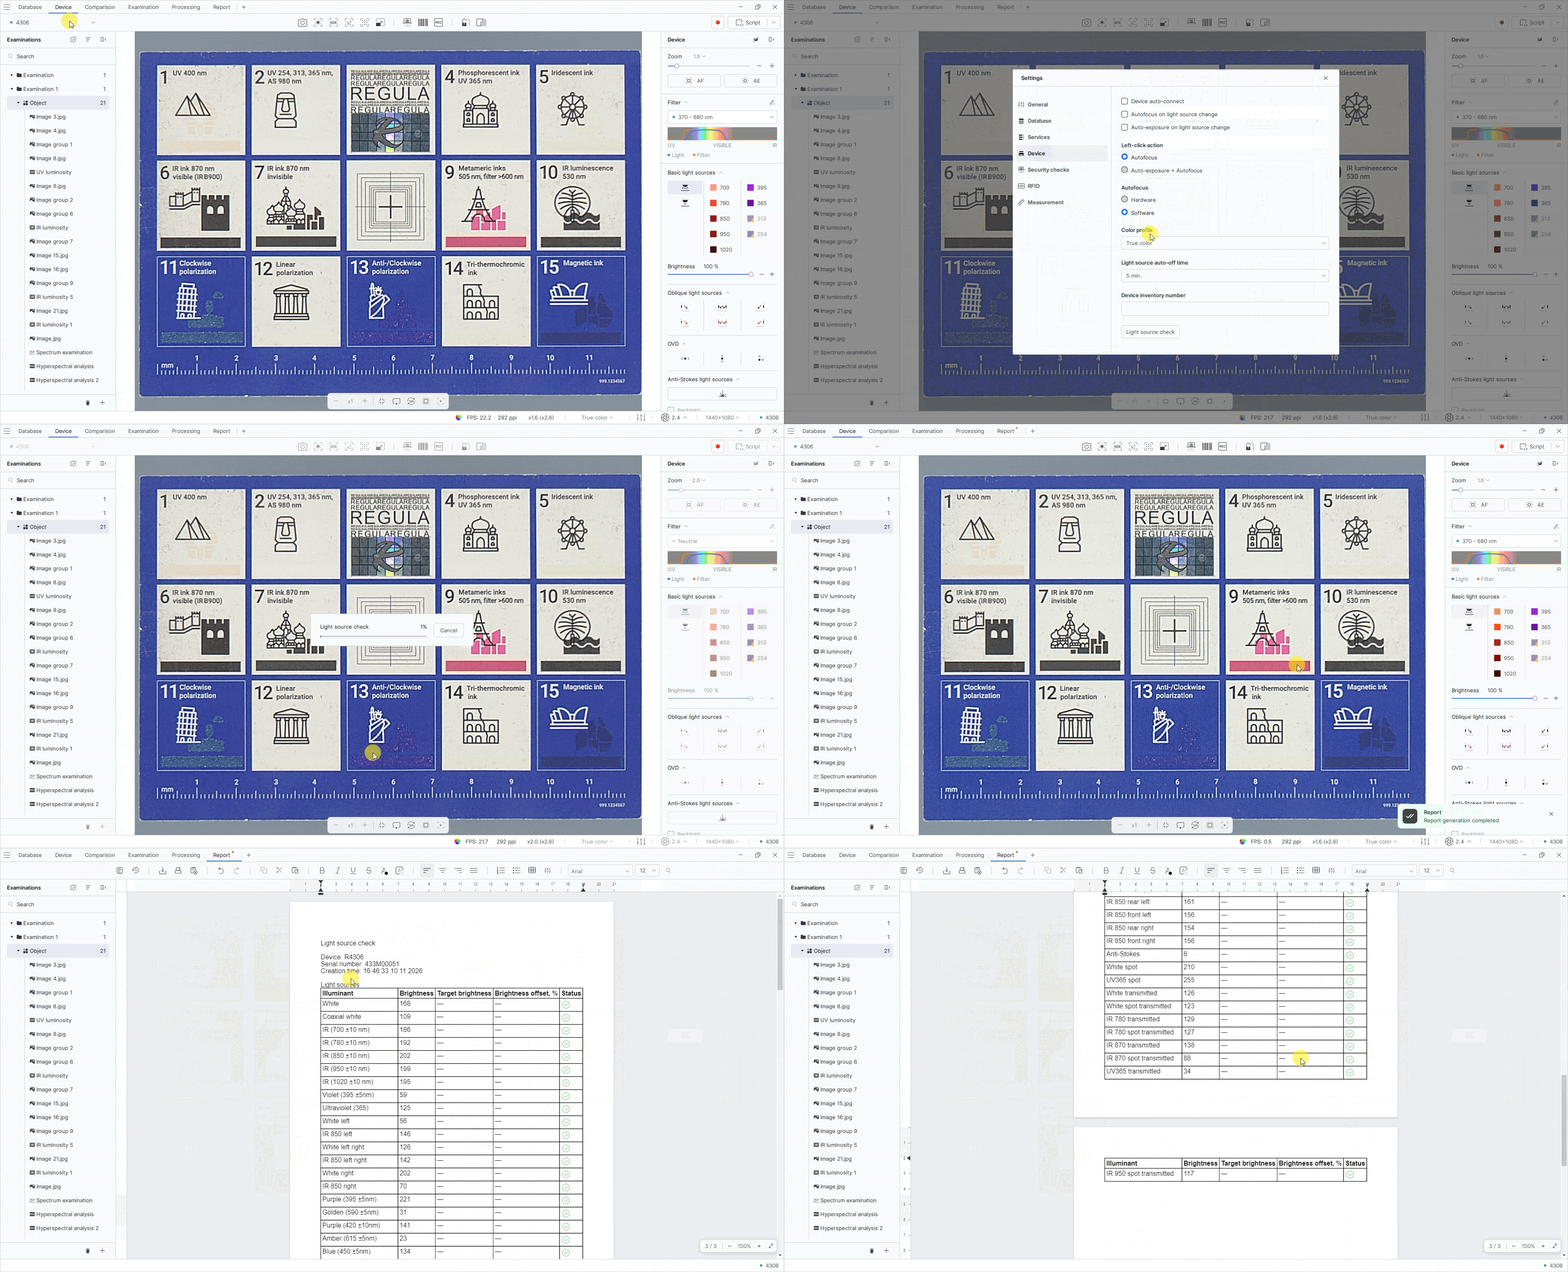
A light source profiling tool has been added as a Light source check button.
To check the light sources, follow these steps:
- Place the RGVI 999.1234567 test object on the scanning surface.
- In the upper-left corner of the screen, open the menu and select Settings.
- On the Device tab, click Light source check.
- Go to the Report tab to view the generated report.
Light source functionality check
A tool has been added to automatically check light source functionality using the camera. The check is performed against target values established during calibration for each light source. When the check is complete, the software automatically generates a PDF report with the results.
To run the check, open Settings, go to the Device tab, and launch the light source check tool.
4308
Added
Adding a Preview function for image stitching
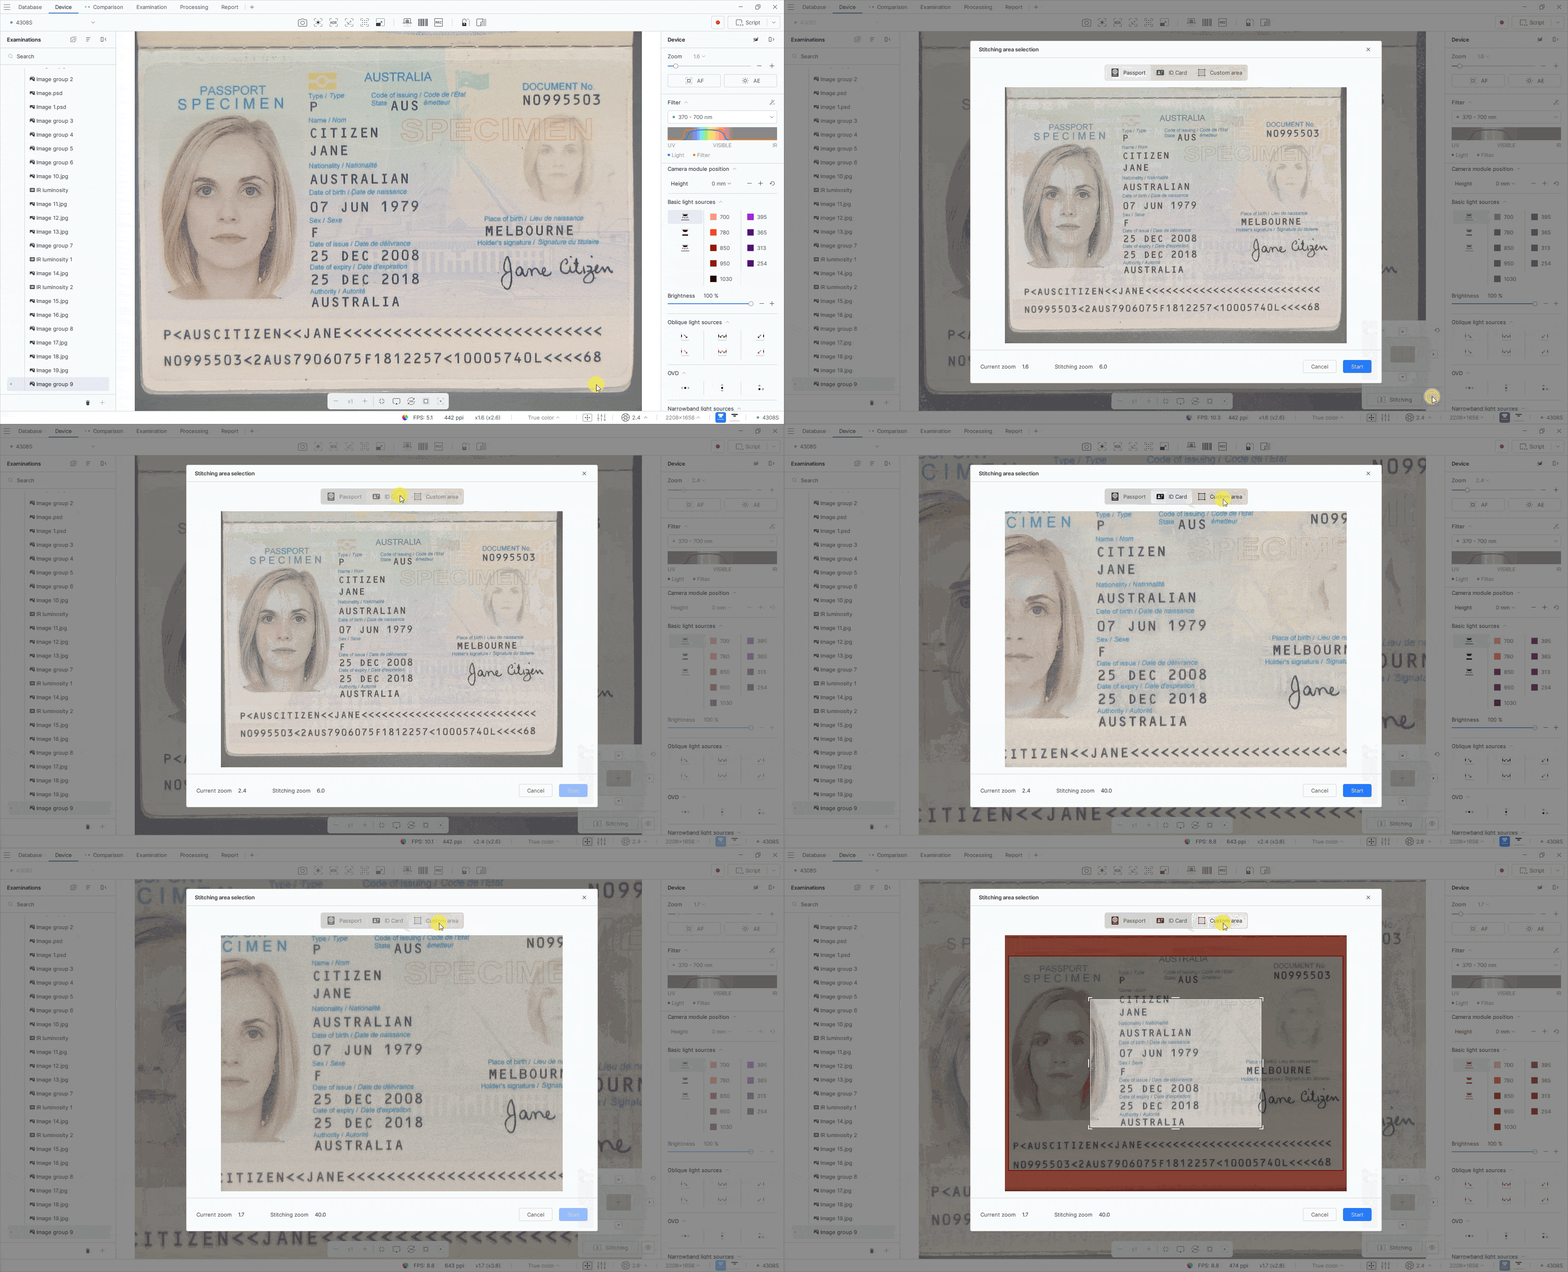
You can now preview and select the stitching area. The Preview window shows the camera image and provides the following templates: Passport, ID card, and Custom area when the coaxial module is connected, or Full and Custom when it is not.
The Stitching button still starts stitching the largest available area. When the coaxial module is used, white light is also enabled to help position the document and is turned off when stitching starts.
Fixed
- Fixed an issue that caused the Regula 4308 to freeze when M-tag mode was enabled.
- Fixed Anti-Stokes mode on the Regula 4308M.
- Fixed overexposure in transmitted white light mode on the Regula 4308M.
- Fixed Start/Stop operation for horizontal and vertical OVD. Clicking Stop now correctly stops the preview and LED switching.
Changed
Changes to Regula 4308 light source operation
Simultaneous use of IR illumination and white light in the basic lighting modes of the Regula 4308 is no longer supported.